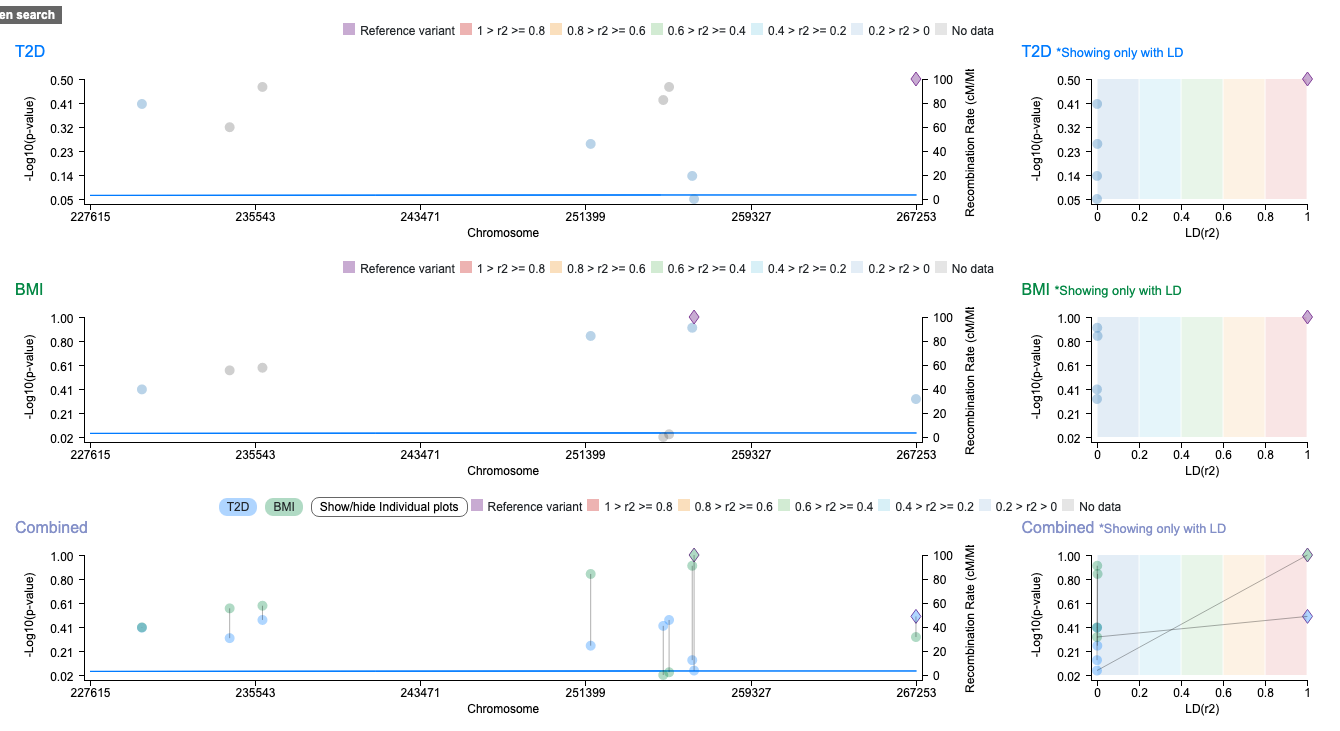
If your research page is GWAS data driven, a region plot can be a good way to visualize the data in the data table. It comes with LD score plots, and a gene track can be added. Data can be rendered in three modes: All (default), Highest in row, and Combined. Users can switch between the modes. Also, it comes with split views that render each of the datasets, if multiple sets of data are loaded, in a separate plot.
Format
{
"type":"region plot",
"x axis field": "position",
"y axis field": "-log10(P-Value)",
"render by": "Variant ID",
"y axis label": "-Log10(p-value)",
"x axis label": "Chromosome",
"hover content": ["P-Value","Beta"],
"height": 120,
"star key":"Variant ID",
"input type":"dynamic",
"dynamic parameter":"region",
"ld server":{"pos":"position","ref":"ref","alt":"alt","ref variant field":"Variant ID","populations field":"P-Value","populations type":"fixed","fixed_population":"ALL","populations":{"ALL":"ALL"}},
"genes track":{"input type":"dynamic","dynamic parameter":"region"}
}
Parameters
type
Type of the plot. In this case, it is "region plot."
x axis field
A column for xAxisField has to be genomic position of a variant. (Ex. 229580) Values for this parameter shouldn't include a chromosome value. There should be only one value should be per row: for example, "229580-229581" is not acceptable.
y axis field
A column with any numeric values can be assigned to the yAxisField parameter.
y axis label
The text assigned for this parameter will appear next to the Y axis on region plots and LD score plots.
render by
A column with unique values through a data can be assigned to this parameter. The rendering script will match rows in each data if there are multiple sets of data, connect them with thin lines on the plot, and calculate combined values for Combined view. Also, values in the assigned column for this parameter will be used to collect data for detailed information popup.
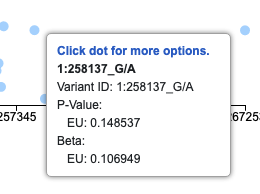
hover content
An array of columns assigned to this parameter will appear in the detailed view popup. [Edit required: More options function for the popup is still under development. ]
height
A number value for the height of each plot. The assigned value should not be wrapped with quotation marks.
star key
Field name to be shared between region plot and data table.
LD server
- ref variant field: To query LD score from the LD server managed by U of Michigan (Edit: Add correct reference & credit), a column of reference variants formatted in the following way is needed: chromosome:position_reference allele/alternative allele. Here is an example of correctly formatted reference variant: 1:229580_T/A.
- populations type:LD server also requires a value for the bases of the subjects' ancestry. Here are the ancestry IDs that can be queried:
- AFR: African
- AMR: American
- EUR: European
- EAS: East asian
- SAS: South asian
- ALL: Mixed ethnic groups
- populations field: The column name with population values
- populations: An object with collection of populations filed values matched with ancestry ids that LD server takes
genes track / region
If the 'genesTrack' object is in the visualizer configuration, and the parameters to query data for the genes track are correctly assigned, the research portal will query genes in the viewing region and associated protein coding information, and render the gene track.
- input type: Input type for the viewing region value can be 'dynamic', 'static' or 'from data.'
- region: If value for 'inputType' parameter is 'static,' the research portal will look for a value of the viewing region in 'region' parameter. The value for this parameter has to be formatted in the following format: chromosome:start-end. (ex: 1:227615-267253)
- dynamic parameter: If value for 'input type' parameter is 'dynamic,' the research portal will look for a value of the viewing region in region search box rendered from 'API Parameters' field[edit: add a link to 'API Parameters' page]. Value for this parameter should match to a parameter name dedicated for region search in 'API Parameters' field.
- region fields: If value for 'input type' parameter is 'from data,' the research portal will look for the columns to compare to find out the start snd the end of the region in the data. This parameter requires field names for 'chromosome' and 'position.'
Here is an example with 'input type' of 'static':
{
"type":"region plot",
"x axis field": "Position",
"y axis field": "-Log10(p-value)",
"render by": "Variant ID",
"y axis label": "-Log10(p-value)",
"x axis label": "Chromosome",
"hover content": ["P-Value","Beta"],
"height": 120,
"input type":"static",
"region":"18:8330000-10401000",
"ld server":{"pos":"position","ref":"ref","alt":"alt","ref variant field":"Variant ID","populations field":"P-Value","populations type":"fixed","fixed population":"ALL","populations":{"ALL":"ALL"}},
"genes track":{"input type":"static","region":"18:8330000-10401000"},
}
Here is an example with 'input type' of 'from data':
{"type":"region plot",
"x axis field": "Position",
"y axis field": "-log10(P-Value)",
"render by": "Variant ID",
"y axis label": "-Log10(p-value)",
"x axis label": "Chromosome",
"hover content": ["P-Value","Beta"],
"height": 120,
"star key":"Variant ID",
"input type":"from data","region fields":{"chromosome":"Chromosome","position":"Position"},
"if combine y axis field":{"type":"average","field":"-log10(P-Value)"},
"ld server":{"pos":"position","ref":"ref","alt":"alt","ref variant field":"Variant ID","populations field":"P-Value","populations type":"fixed","fixed population":"ALL","populations":{"ALL":"ALL"}},
"genes track":{"input type":"from data","region fields":{"chromosome":"Chromosome","position":"Position"}},
"zoom":"true"
}
Example (https://hugeampkpn.org/research.html?pageid=demo_6_n91)
{
"type":"region plot",
"x axis field": "position",
"y axis field": "-log10(P-Value)",
"render by": "Variant ID",
"y axis label": "-Log10(p-value)",
"x axis label": "Chromosome",
"hover content": ["P-Value","Beta"],
"height": 120,
"star key":"Variant ID",
"input type":"dynamic",
"dynamic parameter":"region",
"if combine y axis field":{"type":"average","field":"-log10(P-Value)"},
"ld server":{"pos":"position","ref":"ref","alt":"alt","ref variant field":"Variant ID","populations field":"P-Value","populations type":"fixed","fixed population":"ALL","populations":{"ALL":"ALL"}},
"genes track":{"input type":"dynamic","dynamic parameter":"region"}
}