Let's say you have a data file which has 100,000 rows of data in it (note that we don't recommend loading files this large to BYOR). If you render large amounts of data in vector graphics, the computers of the viewers may have hard time in responding to your requests like filtering or sorting data, due to the number of items they have to re-render even for slight changes in the data and viewing window. You can choose the Manhattan plot in bitmap format in this case. It renders much faster than the vector version and gives almost no burden to the cpu of the viewers' computers.
Format
{
"type":"manhattan bitmap plot",
"x axis field": "position value", //Value must be formatted in "chr : start - end" or "chr : position."
"y axis field": "number value",
"render by": "render key field",
"y axis label": "label",
"x axis label": "label",
"hover content": ["field 1","field 2"],
"height": number
}
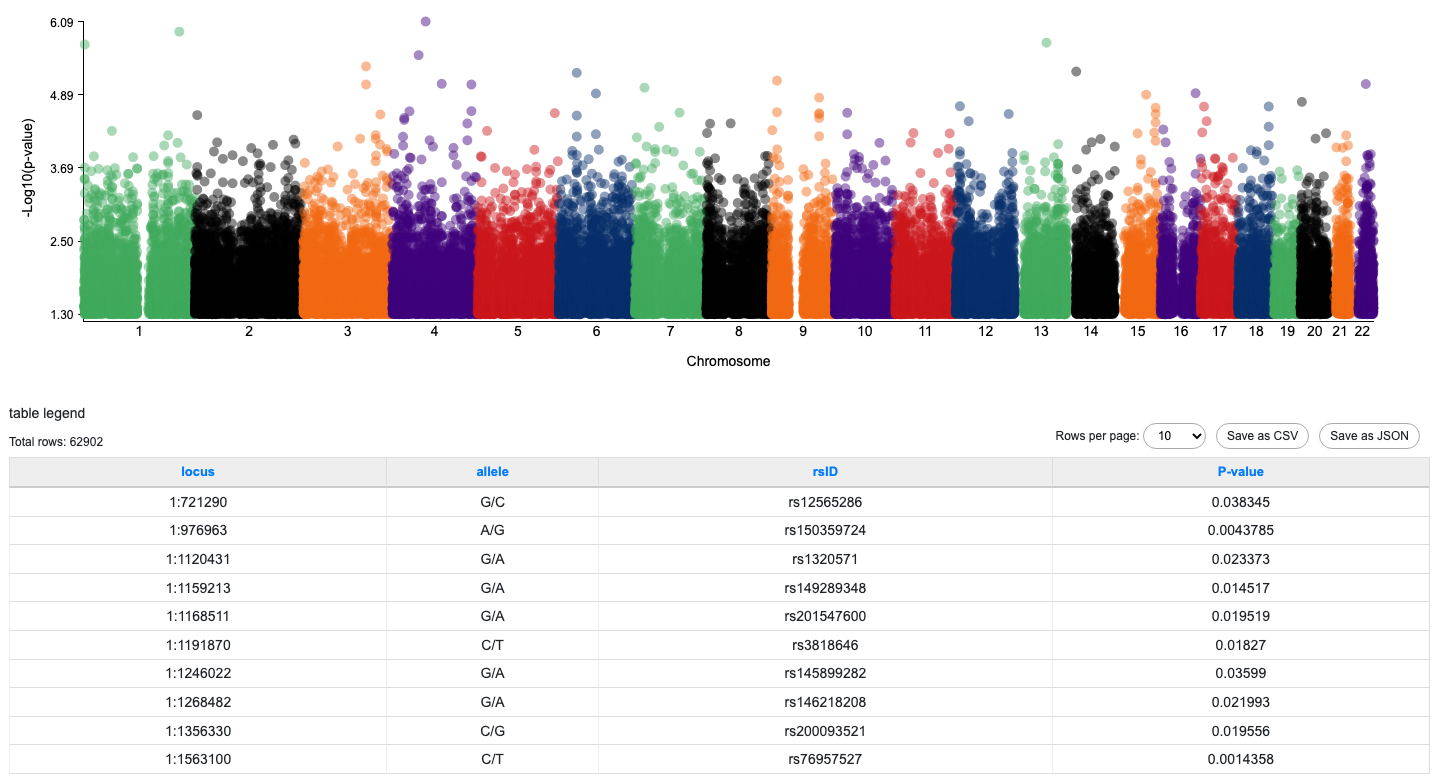
Example (https://hugeampkpn.org/research.html?pageid=demo_2_2_n12)
In this example, the data file contains 62,902 rows of data.
{
"type":"manhattan bitmap plot",
"x axis field": "locus",
"y axis field": "pval_ng_log10",
"render by": "rsID",
"y axis label": "-Log10(p-value)",
"x axis label": "Chromosome",
"hover content": ["locus","P-value"],
"height": 300
}