Format
{
"type":"volcano plot",
"label": "plot label",
"legend": "plot legend",
"render by": "key field",
"x axis field": "field name",
"x axis label": "label",
"y axis field": "field name",
"y axis label": "label",
"width": number,
"height": number,
"x condition": {"combination":"condition","greater than":number,"lower than":number}, //combination for condition can be "greater than", "lower than", "or" and "and."
"y condition": {"combination":"condition","greater than":number},
"dot label score": number //number of conditions that the value of each dot to meet to have labeled
}
Example (https://hugeampkpn.org/research.html?pageid=demo_4_n2)
{
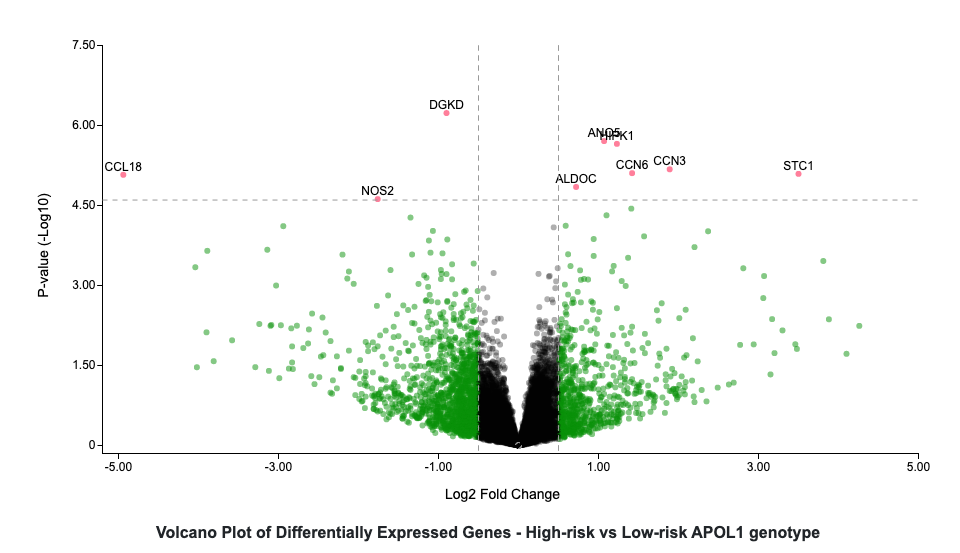
"type":"volcano plot",
"label": "Volcano Plot of Differentially Expressed Genes - High-risk vs Low-risk APOL1 genotype",
"legend": "<span class='volcano-score-0'> </span> NS <span class='volcano-score-1'> </span> Log<sub>2</sub> FC <span class='volcano-score-2'> </span> p-value and log<sub>2</sub> FC<br>Genes with positive fold change are upregulated in high-risk samples",
"render by": "Gene Symbol",
"x axis field": "Log2 Fold Change",
"x axis label": "Log2 Fold Change",
"y axis field": "negLog10P",
"y axis label": "P-value (-Log10)",
"width": 800,
"height": 400,
"x condition": {"combination":"or","greater than":0.5,"lower than":-0.5},
"y condition": {"combination":"greater than","greater than":4.60206},
"dot label score": 2
}