The "Page Description" field allows you to add static content, such as documentation or references, to a research page. The contents added to this field will appear below the page header.
The page description comes with a WSYIWYG editor called CKEditor, with which you can style text, add links to your uploaded files or to external websites, and add tables and images. BYOR also allows you to add inline graphs by adding inline configurations, illustrated below.
Format
<plot> // Opening tag of plot wrapper element
{
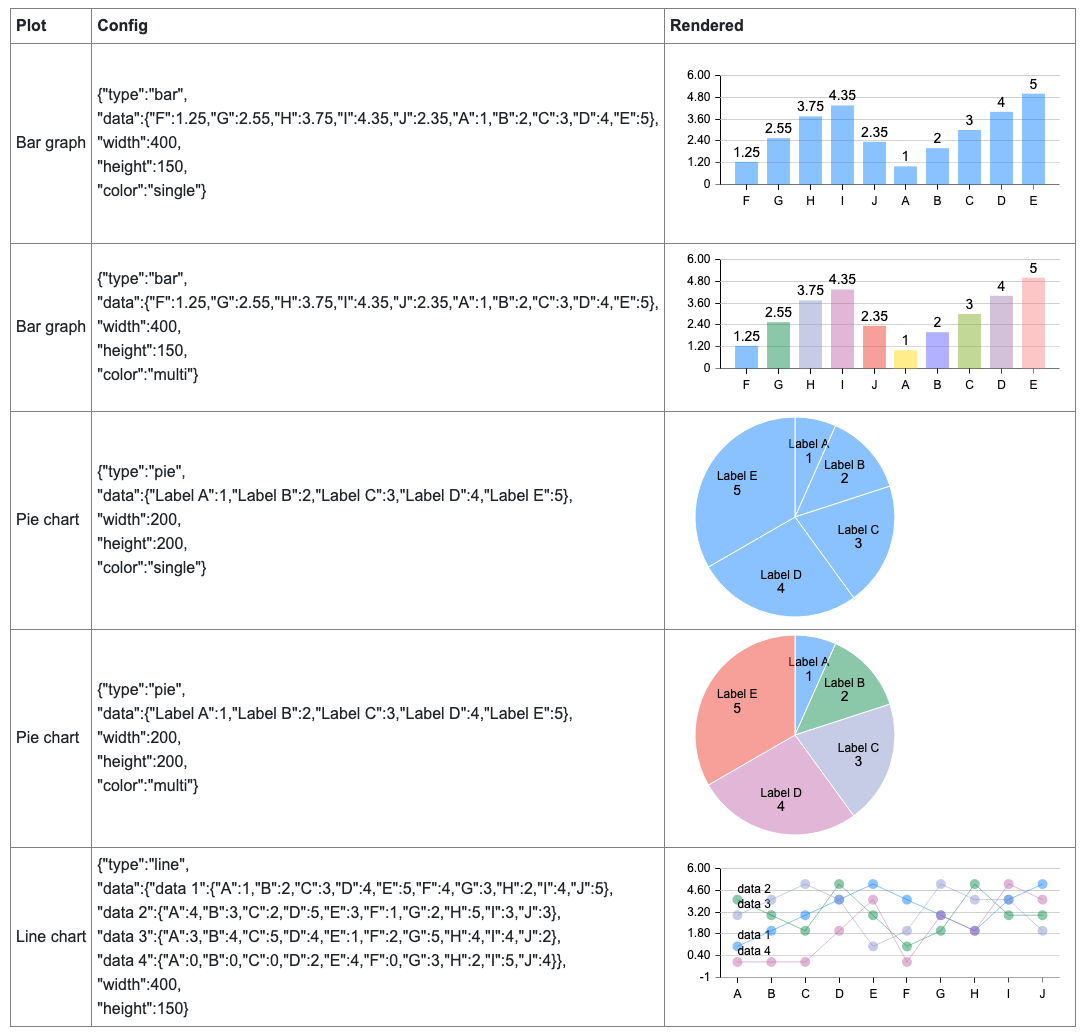
"type":"plot type", //Plot type: bar, pie or line
"data":{"key":value,"key":value}, //Line graph takes set of data. Please look at the example above.
"width":value, //Number value for the width of the graph in pixel
"height":value,//Number value for the eighth of the graph in pixel
"color":"single"//If render the graph in single color or multiple colors
}
</plot-end> // Closing tag of plot wrapper element