Format
{
"type":"heat map",
"label": "plot label",
"main": { //Setting for main defines the colors in squares
"field": "field name",
"label": "label",
"type": "scale", // only "scale" option is available yet
"direction": "positive", //"positive" or "negative"
"low": 0, // lowest value to count
"middle": 0, //median value
"high": 0.25 //highest value
},
"sub": { //Setting for sub defines the size of black dots in squares.
"field": "field name",
"label": "label",
"type": "steps", //"steps" or "scale"
"direction": "negative", // "Negative" or "positive"
"value range": [0.001, 0.05]}, //The number of values is the number of steps the dots bing rendered, no dot to largest dot.
"column field": "column value field",
"column label": "column value label",
"row field": "row field",
"row label": "row label",
"font size": 12 //Font size defines the size of the dots.
}
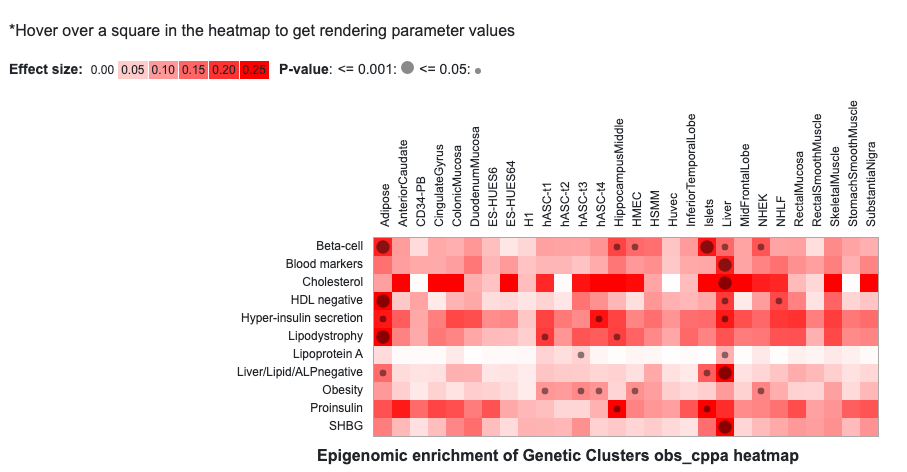
Example (https://hugeampkpn.org/research.html?pageid=demo_5_n5)
{
"type":"heat map",
"label": "Epigenomic enrichment of Genetic Clusters obs_cppa heatmap",
"main": {"field": "obs_cppa", "label": "Effect size", "type": "scale", "direction": "positive", "low": 0, "middle": 0, "high": 0.25 },
"sub": {"field": "p", "label": "P-value", "type": "steps", "direction": "negative", "value range": [0.001,0.05]},
"column field": "annotation", "column label": "annotation",
"row field": "cluster", "row label": "cluster",
"font size": 12
}