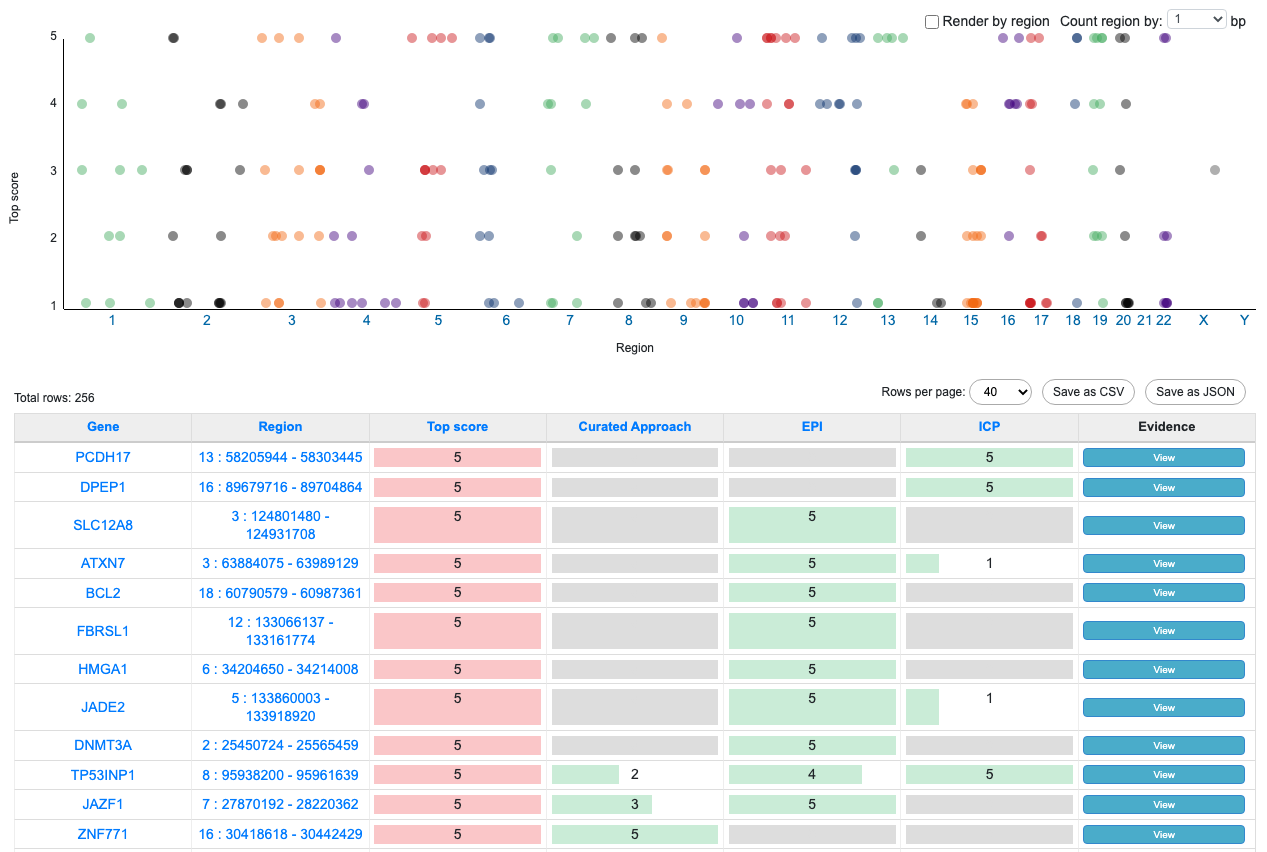
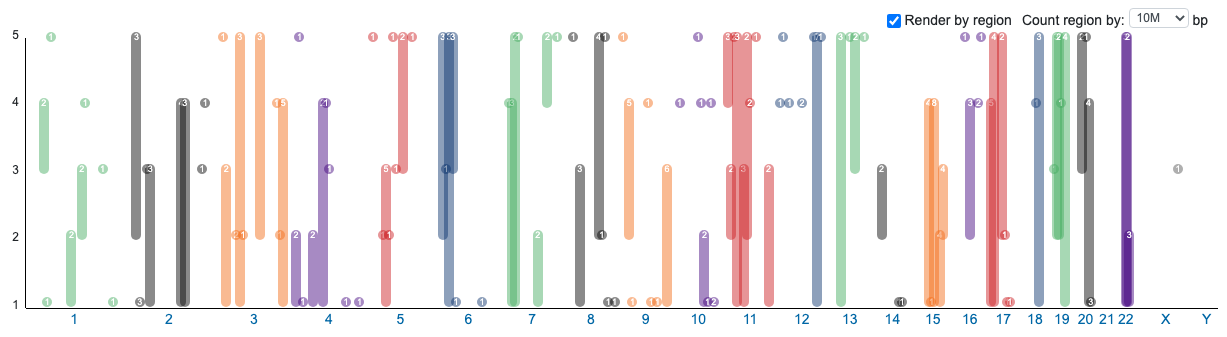
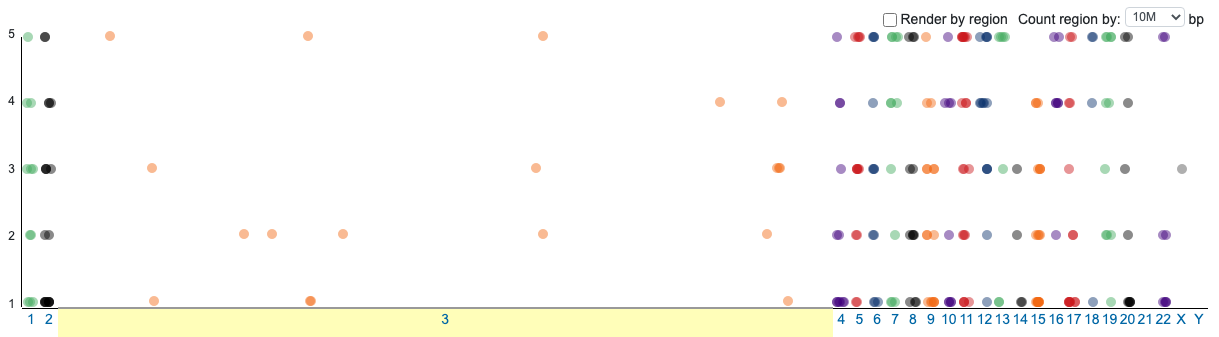
The vector graphics version of the Manhattan plot comes with a few unique features:
1) Items on the plot can be merged by their locations, from 1bp to 10 Mbp.
2) Each chromosome can be expanded for a zoomed view.
3) Dots can be linked to any web pages that take location values as "chr", "start", and "end" parameters.
Format
{
"type":"manhattan plot",
"x axis field": "position value", //Value for "position" can be formatted "chr : start - end" or "chr : position."
"y axis field": "value",
"render by": "key field value",
"y axis label": "label",
"x axis label": "label",
"link to":"link value",
"hover content": ["field 1","field 2"]
}
Example (https://hugeampkpn.org/research.html?pageid=demo_2_1_n101)
{
"type":"manhattan plot",
"x axis field": "Region",
"y axis field": "Top score",
"render by": "Gene",
"y axis label": "Top score",
"x axis label": "Region",
"link to":"/region.html",
"hover content": ["Region","Curated Approach probability","Curated Approach locus","EPI probability","EPI locus","ICP probability","ICP locus"]
}