If you converted your raw data into a new format by adding a "data convert" configuration, or using the raw data, you can format the values in cells in the data table by configuring the "column formatting" property.
Format
You can apply multiple formats to a cell. For example, number values can be formatted in "scientific notation" and "render background percent" can be applied to the formatted values.
"column formatting": {"Field name": { "type": ["type value 1", "type value 2"]}}
Options
Link
Link is added to values in the "Region" field, with the "new tab" option activated:
"Region": { "type": ["link"], "link to": "/research.html?pageid=region_page&phenotype=HEIGHT®ion=","new tab":"true"}
Also the link can be rendered as buttons instead of values:
"Locus link":{"type":["link"],"link to":"/test.html?variant=", "link type":"button","link label":"Open Region"}
Javascript Math method
This method applies any javascript Math methods with no additional parameters to the values in the cell. For example, the values in the "Effective Sample Size" field are processed with a javascript Math 'round.'
"Effective Sample Size":{"type":["js math"],"method":"round"}
You can learn more about Javascript Math here: https://developer.mozilla.org/en-US/docs/Web/JavaScript/Reference/Global_Objects/Math
Scientific notation
Values in the "Score" field are formatted in scientific notation:
"Score": { "type":["scientific notation"] }
Fixed 2-10
Renders the number value in the cell only up to the fixed position after decimal point.
"Score": { "type":["fixed 2"] }
Direction triangle
Renders up or down triangle before the number value in the cell. Up triangle gets rendered in blue. Down triangle gets rendered in red.
"Score": { "type":["direction triangle"] }
Render background percent
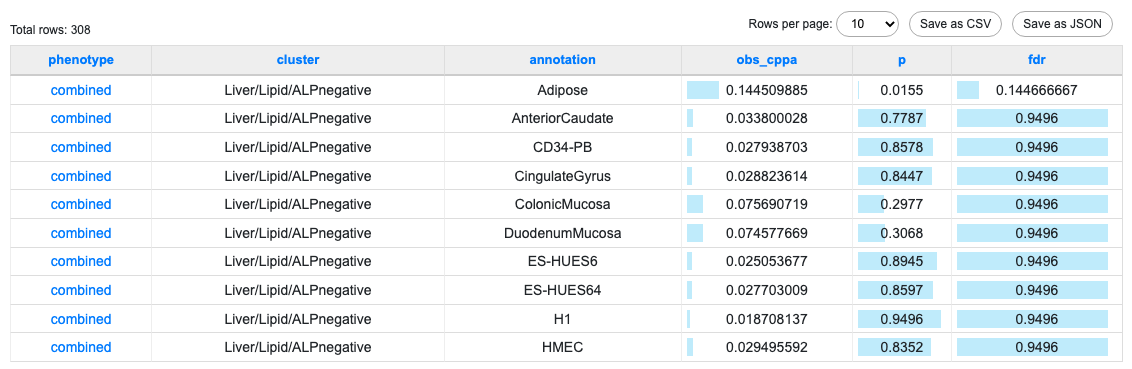
Add a bar graph in the cells under the "obs_cppa" column. BYOR gets the highest and lowest values under the column, calculates the percent value of the value in the cells, and renders bar graphs with the percent value. "percent if empty" property sets the percent value of a cell if no value is in the cell.
"obs_cppa": { "type":["render background percent"],"percent if empty":0}
Render background percent negative
BYOR gets the highest and lowest values under the column, calculates the percent value of the value in the cells, and renders bar graphs with the percent value but in opposite direction. "percent if empty" property sets the percent value of a cell if no value is in the cell.
"obs_cppa": { "type":["render background percent negative"],"percent if empty":0}
Mixing formats
More than one formatting can be applied to a cell in BYOR. For example, the values under "p" column are formatted in "scientific notation," and bar graphs added to cells:
"p": { "type":["scientific notation","render background percent"],"percent if empty":1}
Example
{"top rows":["phenotype","cluster","annotation","obs_cppa","p","fdr"],
"column formatting": { "p": { "type":["scientific notation","render background percent"],"percent if empty":1},
"obs_cppa": { "type":["render background percent"],"percent if empty":0},
"fdr": { "type":["render background percent"],"percent if empty":0},
"phenotype":{"type":["link"],"link to":"https://hugeamp.org/phenotype.html?phenotype="}
}
}