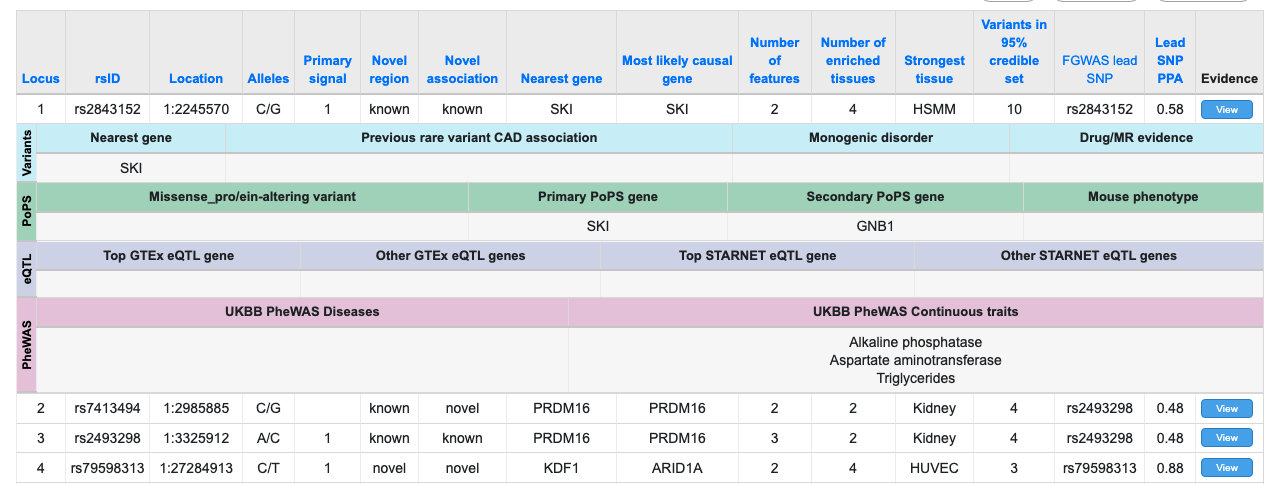
If you choose to create features in your tables, the data table will show an 'Evidence' column. By clicking that, you can view sub-tables with evidence data.
This feature can be added to a data table by adding the 'features' configuration to the data table format. Here is how it gets configured. Let's say you have A, B, C, D, E, E-1, E-2, F, F-1, F-2, G, G-1, G-2 and G-3 columns in your data. You want to show the A, B, C, D, E, F and G columns first, then show E-1, E-2, F-1, F-2, G-1 and G-2 columns in sub-tables when users click the 'View' button.
This can be done by adding the following to the data table format configuration:
{"top row":["A", "B", "C", "D", "E", "F", "G"],
"features":["E group", "F group","G group"],
"E group":["E-1","E-2"],
"F group":["F-1","F-2"],
"G group":["G-1","G-2"]
}
You can see that 'E group', 'F group' and 'G group' labels don't exist in the data but were created to group the columns in the sub-tables.
The rendering engine on the research portal will add an "Evidence" column and 'View' buttons in the cells under the column if it finds the 'feature' config in the table format configuration. Sub-tables will be automatically color coded by the rendering engine.
Creating Features from Hierarchical JSON data
If your data is in JSON format, some fields may already contain subtables. You can use a Feature subtable to display the contents of this lower-level data structure. Take a look at the following example (available as JSON data here):
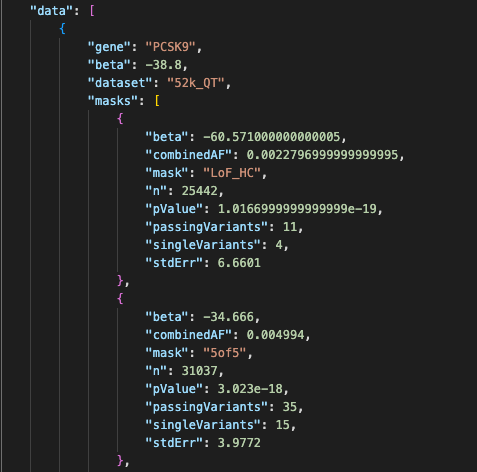
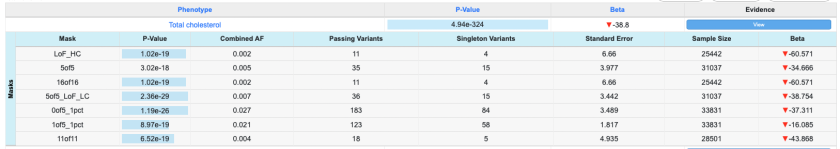
In this dataset, the top-level field "masks" contains an array of JSON objects, each representing a mask. We can create a subtable to show all the masks, as shown on the finished page (available here). It looks like this:
To set up a subtable, construct the data table format object as follows:
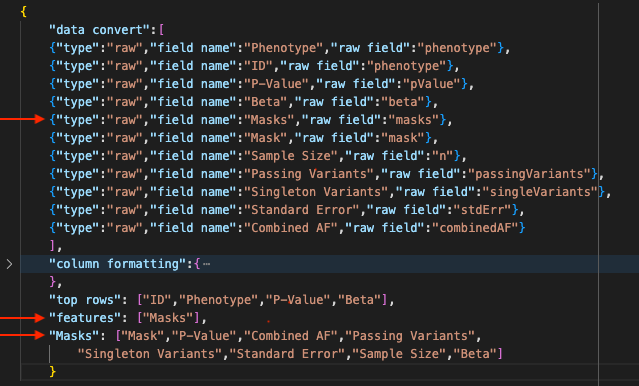
- In the data convert section, we create a raw field entry for the raw field "masks". Here, we simply name it "Masks".
- In the features section, we use the same field name to label our feature "Masks". This ensures that all data displayed in the "Masks" feature will be drawn from the "masks" field in the raw data.
- We set up the "Masks" feature to include the subfields we wish to include from the original "masks" raw field ("Mask", "P-Value", "Combined AF", etc.)
Data Hierarchy and Field Nomenclature
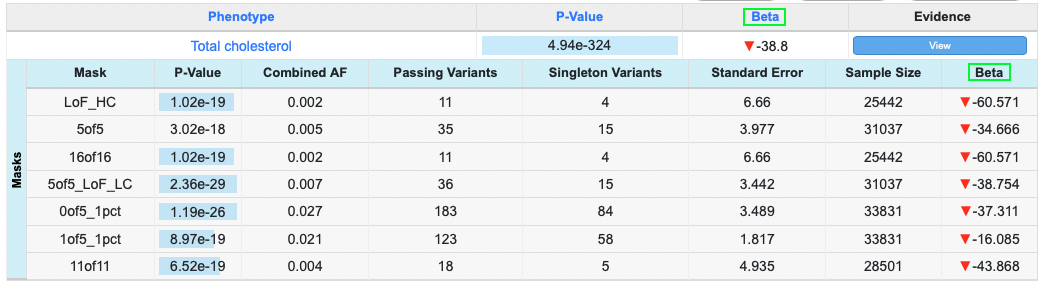
You may have noticed that in the previous example, the raw field name "beta" appears both at the top level of the data and within the "masks" subtable. Field name duplication such as this must be handled as follows:
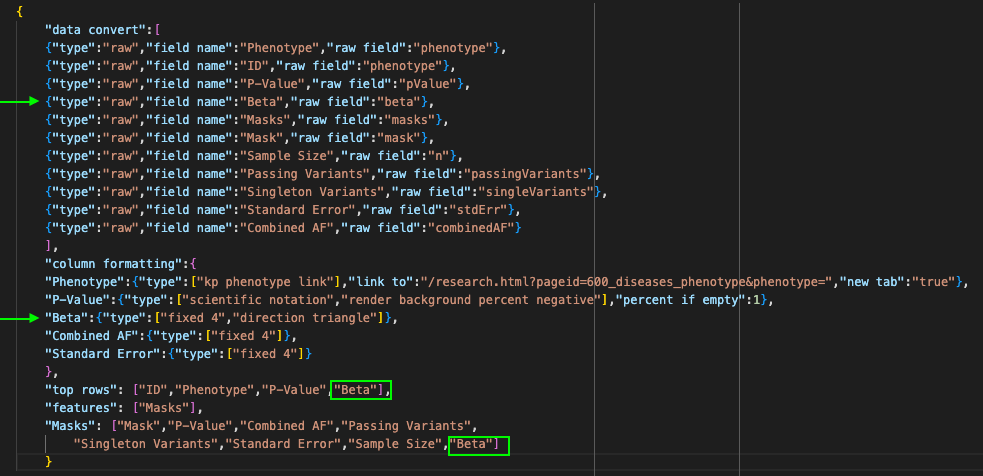
- The data convert section and the column formatting section are not hierarchical. This means that any data conversion you specify will be applied to the "beta" field at any level of the data hierarchy. In this case, the field name "Beta" will be applied to the raw field "beta" in both the top row and the subtable. The column formatting tags "fixed 4" and "direction triangle" will also be applied in both the top row and the subtable.
- The top rows section will only display data from the top-level "Beta" field.
- The "Masks" feature subtable will only display data from the "Beta" subfield within the top-level "Masks" field. This means it is extremely important to name your subtable feature correctly as outlined above. Failure to do so could result in the wrong data being included in your subtable.
- If you do not want to apply the same formatting to all "Beta" fields, you will need to edit your raw data to apply different field names.
To see this formatting in action, view the page and click "View" in the evidence column. Each top-level entry, as well as each mask displayed in the "Masks" subtable, has its own beta value shown and formatted as we specified: